> ## Documentation Index
> Fetch the complete documentation index at: https://leetcode-py.wisl.dev/llms.txt
> Use this file to discover all available pages before exploring further.
> ## Agent Instructions
> leetcode-py is a Python LeetCode practice environment generator with one CLI: lcpy. It is not a service or platform.
> Each problem is a directory under leetcode/ with README.md, solution.py, test_solution.py, helpers.py, and playground.ipynb. lcpy gen creates them from JSON templates bundled with the package.
> Examples are backed by tests; copy them verbatim.
# Visualizations
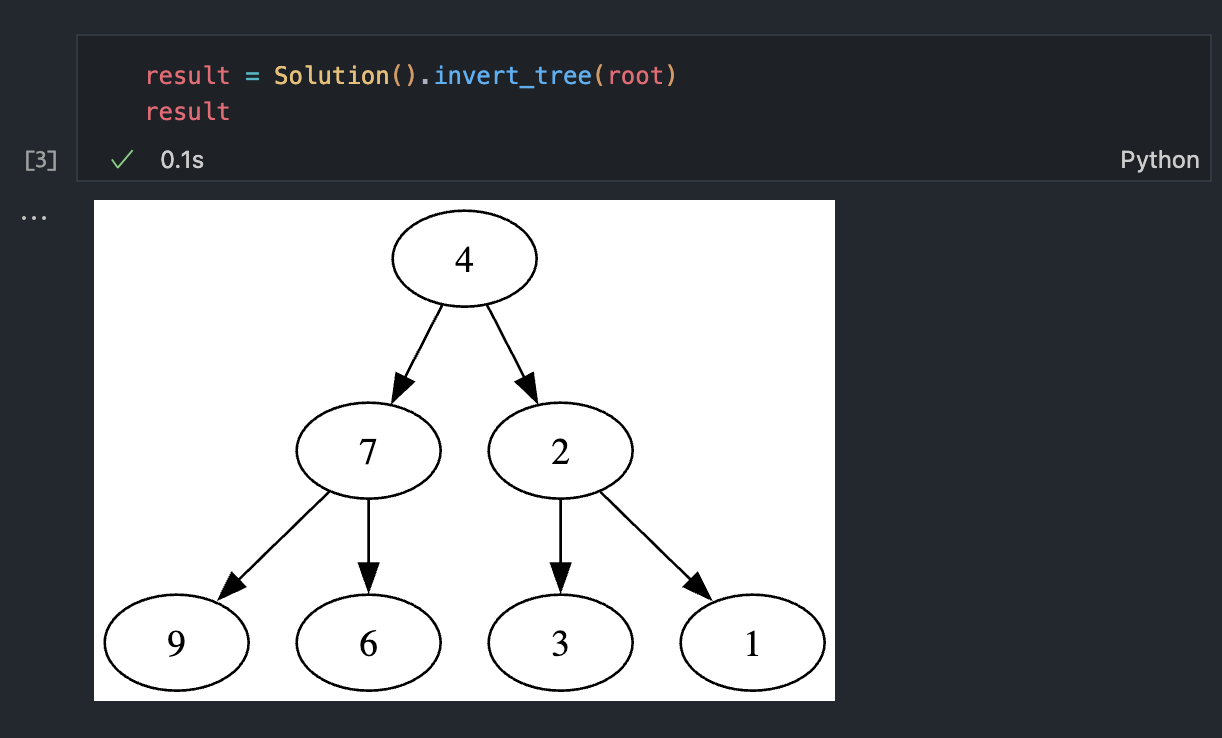
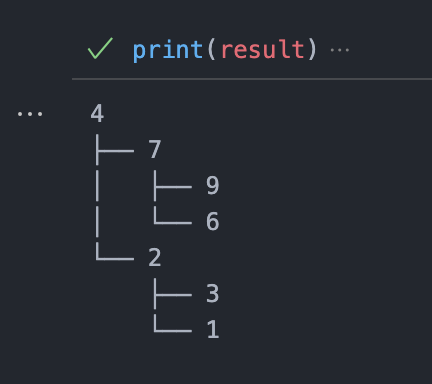
> TreeNode, ListNode, and GraphNode render as diagrams in Jupyter and clean ASCII in the terminal.
The data structure classes from `leetcode_py` convert between LeetCode's
array format and live objects, and render themselves so you can look at
what your code is doing.
```python theme={"theme":{"light":"github-light","dark":"github-dark"}}
from leetcode_py import GraphNode, ListNode, TreeNode
```
## Array format, live objects
```python theme={"theme":{"light":"github-light","dark":"github-dark"}}
root = TreeNode.from_list([3, 9, 20, None, None, 15, 7])
root.to_list() # [3, 9, 20, None, None, 15, 7]
head = ListNode.from_list([1, 2, 3])
head.to_list() # [1, 2, 3]
graph = GraphNode.from_adjacency_list([[2, 4], [1, 3], [2, 4], [1, 3]])
GraphNode.to_adjacency_list(graph) # [[2, 4], [1, 3], [2, 4], [1, 3]]
```
Cyclic lists are safe: traversal detects cycles instead of hanging, in both
directions.
## In Jupyter: diagrams
As the last expression of a cell, these objects render as Graphviz SVG
diagrams. `TreeNode` lays out top-to-bottom; `ListNode` goes left-to-right
with rounded boxes. A cyclic list draws the back-edge in red, dashed, and
labeled `cycle`.
```python theme={"theme":{"light":"github-light","dark":"github-dark"}}
head = ListNode.from_list([1, 2, 3])
head.next.next.next = head.next # cycle: 3 -> 2
head # renders the diagram, cycle included
```
 ## In the terminal: ASCII
`print()` falls back to clean text: an indented tree, an arrow chain for
lists (cycles shown as `... (cycle back to 2)`), and a formatted adjacency
dict for graphs.
```python theme={"theme":{"light":"github-light","dark":"github-dark"}}
print(root)
# 3
# ├── 9
# └── 20
# ├── 15
# └── 7
```
## In the terminal: ASCII
`print()` falls back to clean text: an indented tree, an arrow chain for
lists (cycles shown as `... (cycle back to 2)`), and a formatted adjacency
dict for graphs.
```python theme={"theme":{"light":"github-light","dark":"github-dark"}}
print(root)
# 3
# ├── 9
# └── 20
# ├── 15
# └── 7
```
 ## Requirements
Diagram rendering needs the system Graphviz binary (see
[Installation](/getting-started/installation)). If it is missing, the
objects fall back to the ASCII form, so you get readable output either way.
## Requirements
Diagram rendering needs the system Graphviz binary (see
[Installation](/getting-started/installation)). If it is missing, the
objects fall back to the ASCII form, so you get readable output either way.